CO2e emissions from production
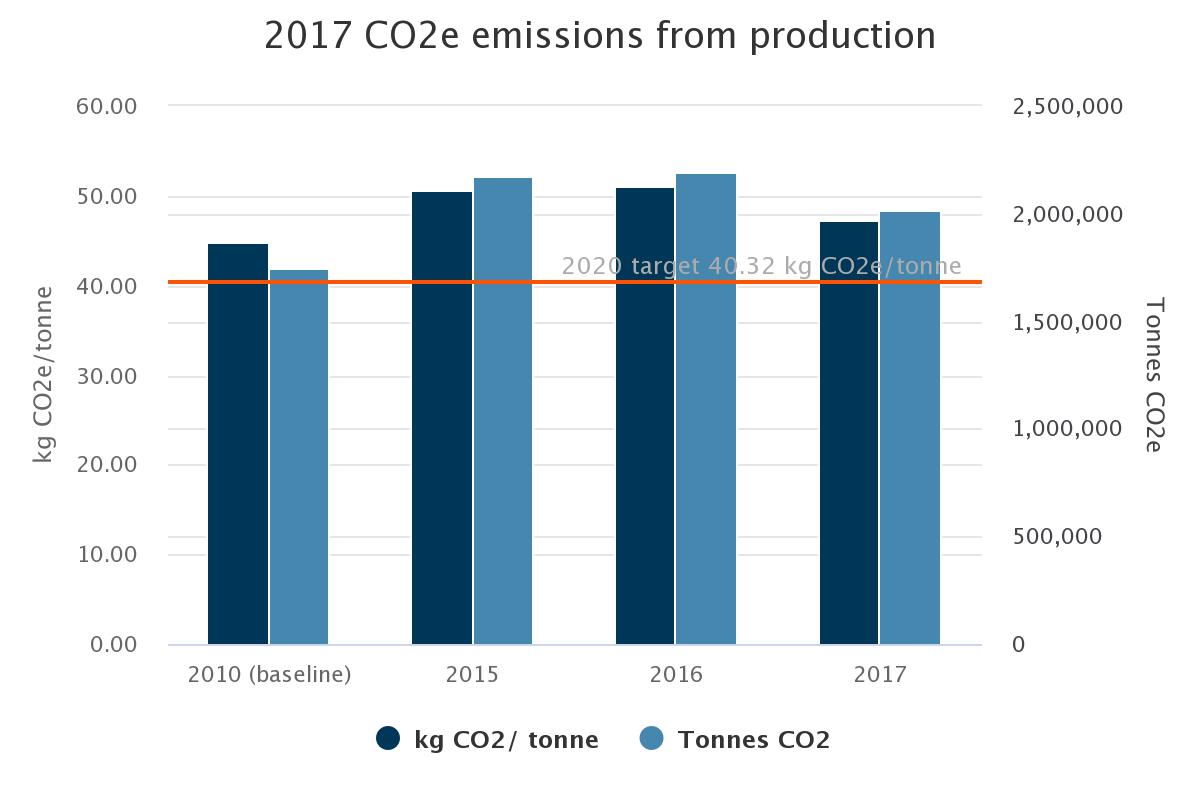
Emissions of CO2 per tonne of product were down by 7.2 per cent from 2016. From our 2010 baseline there was an increase of 5.7 per cent but when the data is normalised to the same product mix as 2010, there was a reduction of 5.4 per cent. The improvement in carbon intensity is largely through increased use of solid recovered fuel which contains around 50 per cent biomass in fuel for cement production. There has also been a reduction across all business lines through a reduction in the carbon intensity of grid electricity of 14 per cent. Grid electricity represents 13.5 per cent of total energy consumption.
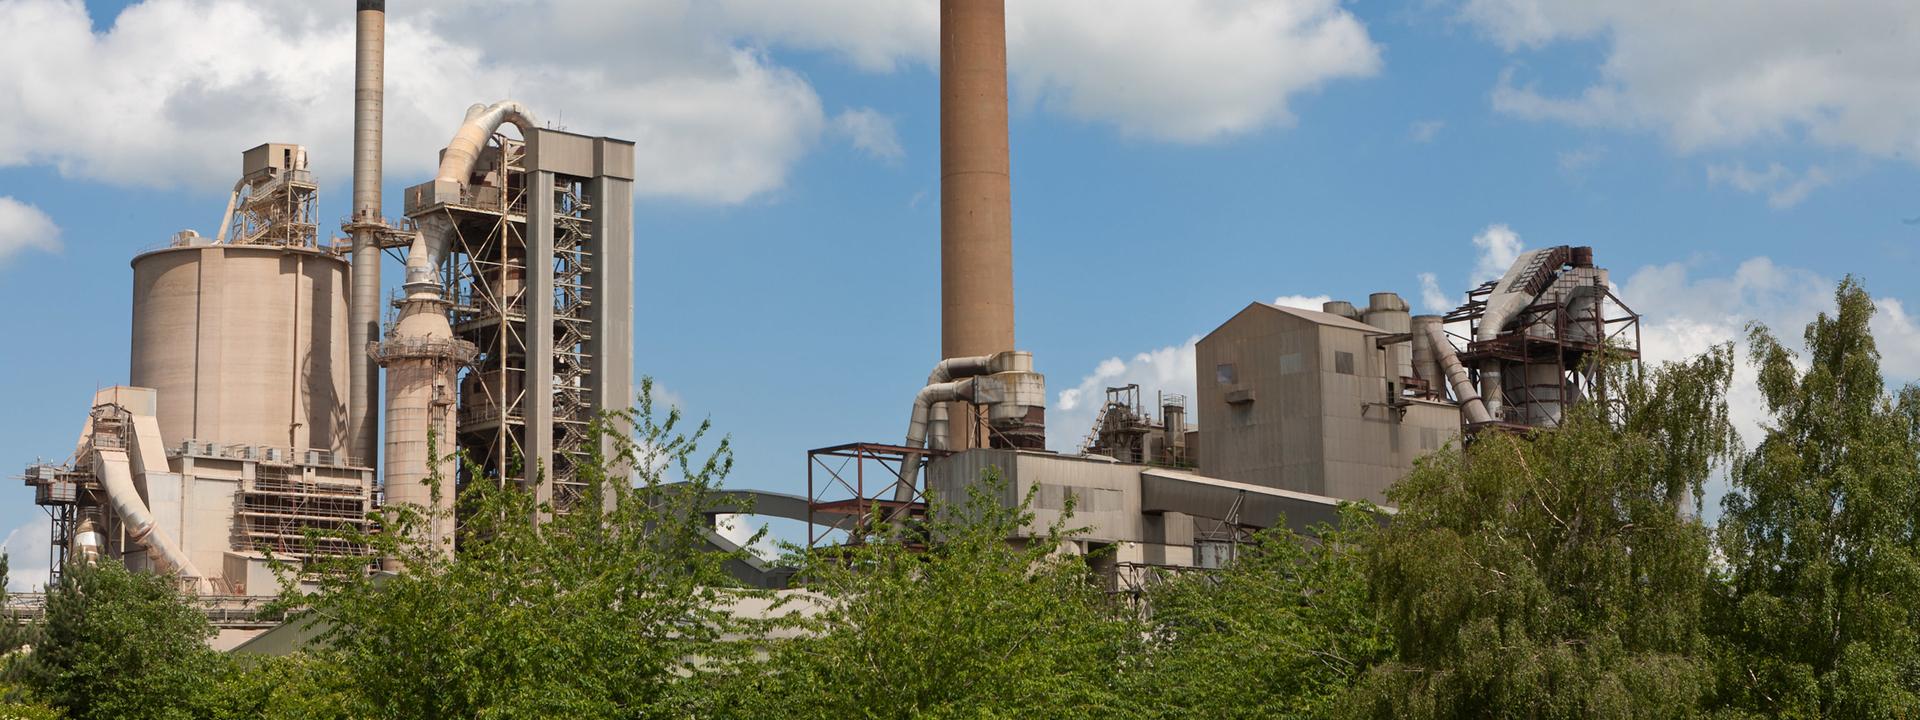
We have not seen as much improvement in carbon emissions from the cement business as we had hoped. The quantity of 100 per cent waste biomass fuel has declined by 60 per cent since 2010. A key factor in this is the use of materials such as meat and bone meal in other combustion processes which has been encouraged by government support schemes not open to cement production, such as the renewables obligation and renewable heat incentive.

-
CO2e emissions from production
2010 (baseline)
2015
2016
2017
% change since 2010
% change since 2016
Kilogrammes of CO2e per tonne of product
44.80
50.65
51.03
47.35
5.7%
-7.2%
Tonnes of CO2e from production
1,751,295
2,171,626
2,194,462
2,012,672
14.9%
-8.3%
Note: All data is scope 1 and 2 emissions using published DEFRA or EUETS 2017 emissions factors.
When normalised for production changes at business line level, the 2017 performance is 41.2 kg CO2e/tonne against a 2010 baseline of 42.8kg CO2e/tonne, showing a reduction of 3.6%


